What Is Diagramming, and How Can It Help You Reach Your Goals?

Did you know that at least 70% of the errors made in the corporate world are from poor communication?
Communication covers a variety of things. It could be related to the general expression of information. I could also pertain to keeping up with employees. Most of the time, though, it has a lot to do with project planning.
Businesses almost always run into hurdles with strategic planning. Whether the issue is from a lack of project alignment or a slowed implementation process, all these problems are preventable. Due to this, business managers are often wondering, “What is diagramming?”
The best answer is that it’s a way to save time and money and to strengthen teams and the chance of project success. Keep reading as we explain what diagramming is, how it’s done, how you can start using this brainstorming method, and why you don’t want to overlook it.
Why Is the Concept Essential to Project Communication and Success?
The best way to explain “what is diagramming?” is by saying that it’s a way to summarize, communicate, and present ideas, concepts, and the final results of something. In almost any industry, it’s a form of communication through words, symbols, and diagrams.
Diagramming is a visual representation of complex problems or processes. It’s used to support collaboration and decision-making in a business. It is also used to develop conceptual models.
This is helpful for visualizing relationships between elements. It’s just as helpful for identifying issues and potential solutions.
Diagramming can help businesses and collaborative teams improve communication. It also helps to facilitate more effective information sharing and promotes collaborative problem-solving. The concept allows team members to break down complicated processes into individual bits of information.
Also, it can help identify trends, inconsistencies, and opportunities for improvement. When you think about it, it simplifies what you must say or present to others.
This form of thinking even helps reduce the loss of information. It also helps with reducing the misunderstanding of information often lost in verbal delivery alone.
Diagramming is a simple way to achieve streamlined workflow improvements as well. It brings the organization closer to the consistent credibility of the information they gather.
The same goes for helping to promote an efficient work environment. This makes it a valuable tool for businesses and teams. Since companies often risk losing upwards of $1.3 million per year from inefficient processes, collaborative brainstorming and process improvement have never been more critical.
Finding shortfalls in a business before they become monetary losses can save a company’s value and preserve its reputation. Something as simple as having a reliable and effective way to form marketing campaigns or create a diagram can help with this goal.
At least a third of the time, projects often fail because of poor communication alone. Diagramming is an essential concept in forming better project communication. It’s also vital for project success. This is due to its effectiveness in conveying complex information.
For data-focused or intelligence teams, it can help identify and organize data. This is possible using a data flow diagram (DFD). Or, it can help theorize data during project projection phases.
For business teams, diagramming is often brought into a project during the later phases of data analysis. This helps significantly with process mapping. Diagramming is an excellent tool for forming successful marketing campaigns for content and marketing teams. It allows you to combine visualizations with the flow of your goals and your proposed strategies.
A clear visual representation of the project helps ensure clear and concise communication among team members. It’s an excellent way to work through a meeting alone or when presenting to stakeholders or a variety of teams. Ultimately, diagramming is a powerful and efficient communication tool that helps increase project success.
How Does This Method of Concept Illustration Work?
Diagramming for brainstorming and communicating business processes in different industries can be effective for any project. When diagramming, it’s essential to consider the context of the task. When beginning your process, assessing what calls to action are needed and what visual elements must be included is vital.
When mapping out the pathways and steps involved in a process, start simple. Focus on what needs to be communicated and what outcomes you want to achieve due to the diagram. Use various labeling options such as numbers, colors, shapes, and arrows to denote that each piece of the process is visualized.
When done right, diagramming can foster communication, collaboration, and, ultimately, successful project completion. To make things even simpler, try following these steps when forming a process diagram:
- Outline your workflow or summarize your ideas
- Conduct and distribute research
- Use a comprehensive tool to aid in the design and mapping process (ex: online whiteboard)
- Start assigning project roles
- Make use of legends and a brainstorming template
- Keep consistency throughout your brainstorming diagram, and keep in mind that whitespace is not a bad thing
- Color coordinate and leave a section for notes off to the side of your diagram
Don’t Forget to Consider the End Goal
You should also consider the goals of your intended audience and even if you’ll be expressing ideas to yourself. A lot of business teams often don’t know where to start. The best place to begin effective diagramming is with an online whiteboard.
A product like this can adapt to any project and produce a variety of elements that meet almost any need. Some teams may need to prioritize design thinking because it’s their most challenging focus area to communicate better.
Other teams may have different priorities, or a team’s goals might fluctuate with time. A collaborative tool that can adapt as your team does can reduce the difficulty experienced in project planning and implementation.
What Are the Advantages?
Keep in mind that different companies will have different goals. Diagramming will offer distinct advantages for these varying goals. Some of the top benefits of diagramming are:
Improved Visualization
Representing complex data points, processes, or ideas in a visual format, can help to improve understanding. It also helps with the breakdown of large data sets.
It’s like turning information into biteable pieces instead of taking everything in, in large chunks. Better visualizations also mean having a standard way to present information to employees of any skill level.
Easier to Share Ideas
A visual display makes it easier for teams to share ideas and concepts. This makes it simpler to collaborate on projects and to ensure everyone is on the same page. Also, with an online whiteboard to help facilitate the delivery of these ideas, it’s easier to use.
Instead of keeping up with paper and physical materials, everything is in a digital space. This makes it easy for audiences to refer back to information.
It also eliminates the barrier of location, making it the perfect tool for remote teams. Not to mention, diagramming this way makes it easier to integrate your ideas with other tools you already use.
Simpler for Memorization
Diagrams can also be easier to remember than lengthy written explanations. This can help present impactful ideas or start a new project. The human brain responds a lot faster and in a more effective way to visuals.
The brain can process visual communication at least 60,000 times quicker than information presented with text. This is something that is often overlooked in business. If you put an image in front of someone, it takes between 13 and 150 milliseconds to process.
In comparison, a complete sentence takes 4 to 8 seconds to comprehend. Diagramming is a combination of both. We could argue that adding a diagram or image with text could also be better understood and taken in by the audience.
Instead of going for a more narrative-based delivery, visuals are generally more helpful. Sharing your ideas this way will often impact your audience more.
Clearer Communication
Because diagrams are visual, they provide a simple way to communicate more clearly. Something as simple as a concise information presentation helps to save time and improve efficiency.
Believe it or not, visualization improves retention rates by 50%. It even enhances learning by 400%. There are a variety of advantages to tap into with this approach of better team connectivity.
Diagramming with Marketing and Content-Focused Teams
Diagrams can be helpful in the marketing and content production industries. They offer a visual approach to communicating ideas and marketing concepts. For example, flowcharts are a great way to illustrate processes.
It’s also an excellent way to show the paths that customers might take when engaging with a product or service. In comparison, organizational charts can help to show the different team roles. It also indicates the responsibilities of those roles within a team.
Mind maps, unlike traditional diagrams, allow marketers to visually lay out non-linear concepts or topics that naturally evolve. With these tools, marketers can bring together written content and images.
They can also combine interactive visualizations to engage their customers. This is an excellent way to create a powerful narrative across all teams.
At least 70% of all projects fail. Most of the time, that failure has a lot to do with inadequate forecasting and misallocation of resources. It also has a lot to do with communication and the misunderstanding of concepts or project roles.
Collaborative brainstorming and workflow improvement can help combat these issues. A tool like an interactive whiteboard across all involved teams can help facilitate these improvements.
Taking the Technical Route and Learning to Use Diagramming for Complex Concepts
Diagramming can be a powerful tool for technical teams. It can also do a lot more than only collaborate and identify problems. It’s an outlet for thinking outside the box and developing creative solutions.
Teams can explore more by creating diagrams to represent complex data points or processes. They can visually represent a hypothesis and identify potential problem areas with it.
This also could help to visualize technical calculations. This can be useful for teams engaging in scientific research or experimentation.
Discovering the Tools That Make Diagramming Simple and Effective
For diagramming in any industry, the most effective tools depend upon the type of project. For instance, if the goal is to illustrate the company’s workflow, a swimlane diagram is a practical choice.
Additionally, flowchart diagrams can be used to illustrate the steps, decisions, and outcomes of a process. Both tools are helpful in process identification. There are other popular tools, such as UML diagrams and decision tree diagrams.
There are also mind maps and organizational charts. These options can be used better to understand the project’s objectives and relationships between elements.
Annotations, when used correctly and sparingly, can help strengthen the content of a diagram further. Other types of diagrams are versatile and can be used in various projects.
An activity diagram, for example, is an excellent way to present information to development teams. This type of diagram falls within the UML behavioural visualization realm.
It’s also easy to create with an online whiteboard. Organization charts and wireframes are great for sharing flow and presenting intentions.
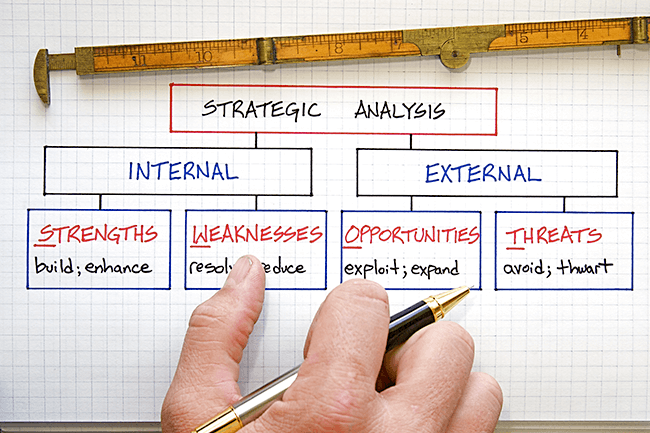
SWOT analysis is a fundamental tool that pairs well with strategic planning and outlining projections. You may even be surprised to find that developing this along with a PESTLE analysis can be easy. This is something that pairs well with SWOT analysis and is excellent for teams that focus on the future impacts of projects.
This makes it an excellent tool for project managers and coordinators. All of these diagramming routes can be achieved with an interactive online whiteboard.
Diagramming and Project Success at Its Finest
Now, you have an answer to “what is diagramming?”. The first step to starting with the concept is finding a collaborative tool that suits your team well. Whether you have an in-office, hybrid, or remote work model, there is a solution to strengthen your team and integrate the tools they use.
If you want to ignite your team’s collaboration, Huddle IQ has resources tailored to help you achieve success. Learn more about what we do to get started and optimize the way you work.